
Are you looking for a reliable way to identify overbought and oversold conditions in the market? The Williams %R Oscillator could be the missing piece in your trading strategy.
Understanding the Williams %R Oscillator
The Williams %R Oscillator is a momentum-based technical indicator developed by trader Larry Williams. It helps traders and investors gauge market conditions by pinpointing overbought and oversold levels, making it an essential tool for spotting potential price reversals.
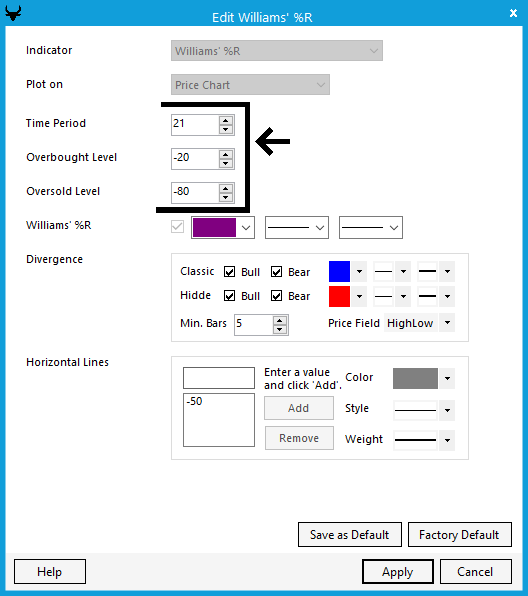
This indicator measures an asset’s current closing price in relation to its highest and lowest prices over a specified period, typically 14 days. The values range from -100 to 0:
- Above -20: Overbought conditions, suggesting a possible downward correction.
- Below -80: Oversold conditions, indicating potential upward momentum.
While the Williams %R doesn’t guarantee immediate reversals, it provides critical insights when used alongside other indicators or chart patterns.
Note: This momentum oscillator is similar to other well-known indicators such as the Relative Strength Index (RSI) and Stochastic Oscillator.
Looking for information on the Williams’ %R stock screener? Click here.
How to Use the Williams %R Oscillator in Trading

Identifying Overbought and Oversold Conditions
One of the primary uses of the Williams %R Oscillator is to detect overbought and oversold conditions that may precede price reversals.
- If a stock has been rising and the Williams %R moves above -20, it may signal an overbought market and a potential pullback.
- Conversely, if the Williams %R drops below -80 after a prolonged downtrend, it may indicate an oversold market and a potential buying opportunity.
Spotting Trend Reversals with Divergence
Divergence occurs when price action and the Williams %R indicator move in opposite directions, signaling a weakening trend and a possible reversal.
- Bullish Divergence: Price forms lower lows while Williams %R forms higher lows, suggesting a shift toward upward momentum.
- Bearish Divergence: Price forms higher highs while Williams %R forms lower highs, signaling weakening buying pressure and a potential downtrend.
Divergence is a powerful tool for traders looking to anticipate market shifts before they occur.
Using Crossovers for Entry and Exit Signals
Traders often look at crossovers to time their market entries and exits effectively:
- A cross above -50 suggests a transition into a bullish phase, indicating a possible buy signal.
- A cross below -50 suggests a shift toward bearish momentum, signaling a potential exit or shorting opportunity.
Crossovers are particularly effective when combined with trend-following or momentum indicators for confirmation.
Enhancing Trades with Trend Indicators
Williams %R becomes even more powerful when used alongside trend-following indicators such as Moving Averages or the MACD:
- Oversold Williams %R with price above the 50-day moving average: Suggests a temporary pullback in a broader uptrend, potentially presenting a buying opportunity.
- Overbought Williams %R with price below the 200-day moving average: May indicate a weakening trend, making it a viable shorting opportunity.
Practical Applications for Investors
For long-term investors, the Williams %R Oscillator helps identify optimal entry and exit points by highlighting when a stock is undervalued or overextended:
- Buying near oversold levels can increase the likelihood of acquiring stocks at lower prices before a potential recovery.
- Selling near overbought levels can help investors lock in gains before a possible downturn.
This approach works well for those managing longer-term positions while capitalizing on short-term fluctuations.
Advanced Strategy: Combining Williams %R with Support and Resistance
A more advanced approach is to pair Williams %R with support and resistance levels:
- Oversold Williams %R near a strong support level: Reinforces a potential buying opportunity.
- Overbought Williams %R near a key resistance level: Strengthens the case for a potential short trade or profit-taking.
By aligning this strategy with other technical indicators, traders can significantly improve their market timing.
Conclusion
The Williams %R Oscillator is a simple yet effective tool for identifying potential market reversals and trends. Whether you’re trading short-term or investing long-term, this indicator provides actionable insights to improve decision-making.
Want to enhance your trading strategies with powerful tools like Williams %R? Sign up for ChartAlert’s paid 4-week evaluation trial today and experience cutting-edge market analysis in 3rd party real-time and end-of-day formats.
For examples of customizable Williams’ %R factory scans that can be edited, modified, or revised, and subsequently scanned through ChartAlert’s native stock screener or technical analysis scanner, click here.