
This functionality was introduced in October 2023 (Version 23.10.1)
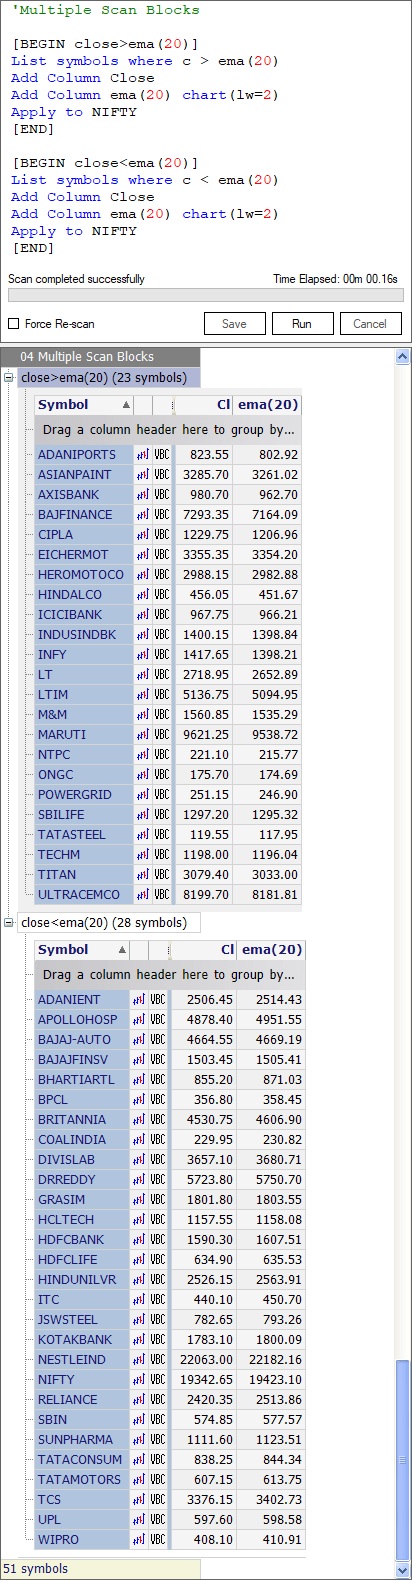
Below is an illustration of an optimized scan that can be created using the Advanced Scanner in ChartAlert.
This one enhanced scan now replaces the need for maintaining two separate scans as was required in the previous versions of ChartAlert.
These Multiple Scan Blocks actually function like a screener, by incorporating two sections of code (each marked with its own BEGIN/END statements) designed to identify and analyze two separate conditions.
[BEGIN close>ema(20)]

List symbols where c > ema(20)

Add Column Close
Add Column ema(20) chart(lw=2)

Apply to NIFTY500

[END]

[BEGIN close<ema(20)]

List symbols where c < ema(20)

Add Column Close
Add Column ema(20) chart(lw=2)

Apply to NIFTY500

[END]
Below is a breakdown of the scan presented in a step-by-step manner.
Purpose of the Scan
- To generate a list of symbols where the latest Close is above EMA(20) or the 20-bar Exponential Moving Average.
- To also generate a list of symbols where the latest Close is below the same EMA(20).
- To display the values of the latest Close and the 20-bar EMA in the scan results report.
- To plot the 20-bar EMA on the chart if a symbol is opened from inside the scan results report.
- To scan the components of the following index: Nifty500.
Let’s go!
Line 1
[BEGIN close>ema(20)]The first section or block of the optimized scan procedure starts with a “BEGIN” command.
The text “close>ema(20)” that comes after the “BEGIN” command serves as the designated heading for the scan results that will be showcased in the scan report.
Line 2
List symbols where c > ema(20)This scan will generate a list of symbols where the value of “c” (representing the latest Close) is current above “ema(20)”.
Here, “ema(20)” refers to the Exponential Moving Average of the closing prices with a setting of 20-bars . . . In the context of daily time-frame, this would mean 20-days.
Line 3 and 4
Add Column Close
Add Column ema(20) chart(lw=2)
In this scan, the function “Add Column…” serves the purpose of displaying additional columns within a scan report.
In this case, the following two columns will be displayed: the latest closing value, and the latest value of the 20-bar EMA.
These columns will be titled “Close” and “ema(20)”, respectively.
The function “chart(lw=2)” will simply plot the moving average on the chart of the resultant symbol in ChartAlert, and the line width of the moving average would be set at 2 pixels.
Line 5
Apply to NIFTY500The “Apply to…” function applies the scanning process to a segment, NIFTY500 in this case, and the scan will effectively examine all the constituent elements of that Index.
Line 6
[END]The optimized scan code of the first block concludes with an “END” statement.
Line 7
[BEGIN close<ema(20)]The second section or block of the optimized scan procedure also starts with its own “BEGIN” command.
The text “close<ema(20)” that comes after the “BEGIN” command serves as the designated heading for the scan results that will be showcased in the scan report.
Line 8
List symbols where c < ema(20)This scan will generate a list of symbols where the value of “c” (representing the latest Close) is current below “ema(20)”.
Here, “ema(20)” refers to the Exponential Moving Average of the closing prices with a setting of 20-bars. and in the context of daily time-frame, this would mean 20-days.
Line 9 and 10
Add Column Close
Add Column ema(20) chart(lw=2)
In this scan, the function “Add Column…” serves the purpose of displaying additional columns within a scan report.
In this case, the following two columns will be displayed: the latest closing value, and the latest value of the 20-bar Exponential Moving Average.
These columns will be titled “Close” and “ema(20)”, respectively.
The function “chart(lw=2)” will simply plot the moving average on the chart of the resultant symbol in ChartAlert, and the line width of the moving average would be set at 2 pixels.
Line 11
Apply to NIFTY500The “Apply to…” function applies the scanning process to the NIFTY500 Index, and the scan will effectively examine all the constituent elements of NIFTY500.
Line 12
[END]The optimized scan code of the second block concludes with an “END” statement.
The Scan Report in ChartAlert
Take a look at an identical scan that includes the “Set report type to SUMMARY” function: Example 12: Multiple Scan Blocks (like a screener) (“Set report type to…”)