This functionality, pertaining to Relative Rotational Charts (RRC), was introduced in October 2023.
RRC Scan Example #2:
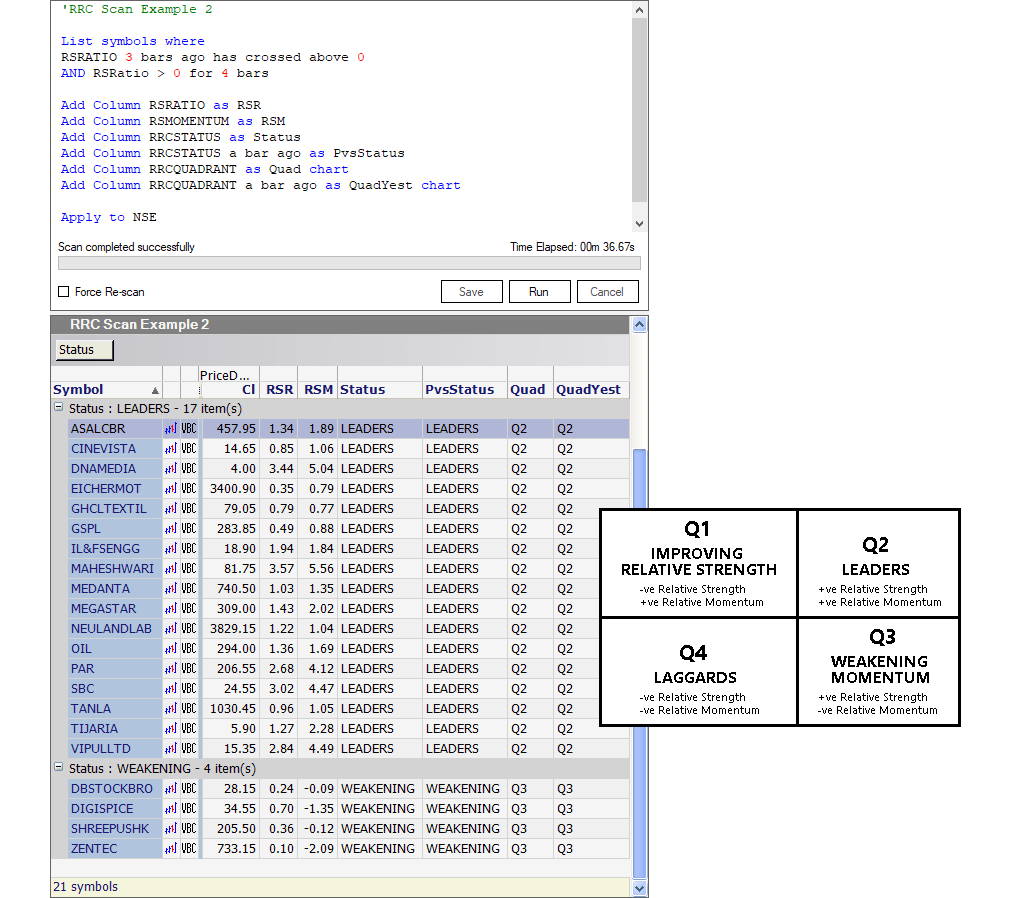
Identify stocks that are showing signs of improvement AFTER a period of underperformance
List symbols where
RSRATIO 3 bars ago has crossed above 0
AND RSRatio > 0 for 4 bars

Add Column RSRATIO as RSR
Add Column RSMOMENTUM as RSM
Add Column RRCSTATUS as Status
Add Column RRCSTATUS a bar ago as PvsStatus
Add Column RRCQUADRANT as Quad chart
Add Column RRCQUADRANT a bar ago as QuadYest chart

Apply to NSE
Purpose of the Scan
The purpose of this scan is to identify stocks that have recently shown signs of improvement (where RSRATIO has crossed above 0, three bars ago) after a period of underperformance, and they have continued to do well for the last four time periods.
It’s like finding stocks that are on a relative upswing in their performance on the NSE.
Lines 1 through 3
List symbols where
RSRATIO 3 bars ago has crossed above 0
AND RSRatio > 0 for 4 bars
The scan looks at the indicator function called “RSRATIO“, but it’s interested in what happened three time periods ago (or “3 bars ago“).
Imagine you’re looking at a chart of a stock’s performance, and three bars ago, the “RSRATIO” line “has crossed above 0” after having remained below 0 previously.
In simpler words, it’s finding stocks where (“List symbols where …“), a little while ago, their performance indicator started getting better.
Then, it’s checking another condition related to the same indicator “RSRATIO”, wherein it wants to find stocks where the “RSRATIO” is greater than 0 for four consecutive bars (“AND RSRatio > 0 for 4 bars“).
Think of this as looking for stocks that have been consistently doing well for the last four time periods.
Line 4
Add Column RSRATIO as RSRThis line instructs the scan to create a column (“Add Column“) called “RSR” and list the values of the “RSRATIO” function into it. This is done to make it easier to work with the RSRATIO data.
The column title “RSR” can be modified or personalized to your preference.
What is “RSRATIO”?
The “RS-Ratio” indicator is a crucial input used in Relative Rotational charts (RRC).
It’s a valuable tool for assessing how strong or weak a symbol’s trend is compared to a benchmark index, like the Nifty.
If the RS-Ratio is above 0, it means the symbol is in an uptrend and is showing strength. If the ratio is below 0, it suggests a downtrend and indicates weakness.
Line 5
Add Column RSMOMENTUM as RSMSimilarly, this line creates a column (“Add Column“) called “RSM” and copies the values of the “RSMOMENTUM” function into it. Again, it’s for convenience and analysis.
The column title “RSM” can be modified or personalized to your preference.
What is “RSMOMENTUM”?
The “RS-Momentum” indicator, which is used in Relative Rotational charts (RRC), helps us understand how quickly the RS-Ratio indicator is changing.
In simpler terms, it tells us if the RS-Ratio is gaining or losing strength. Think of it as a kind of indicator for the main indicator.
The RS-Momentum moves up and down, oscillating around the 0 level.

Line 6
Add Column RRCSTATUS as StatusHere, a new column called “Status” is added (“Add Column“), and it contains information related to the stocks’ status or condition (“RRCSTATUS“) in the context of a Relative Rotational chart’s (RRC) scatter plot.
The column title “Status” can be modified or personalized to your preference.
What is “RRCSTATUS”?
Relative Rotational charts (RRC) are a visual tool for comparing how strong and fast a symbol is performing.
These charts have two lines, one going left to right (horizontal X-axis; the RS-Ratio) and one going up and down (vertical Y-axis; the RS-Momentum).
Where these lines cross at a point marked ‘0’ divides the chart into four quadrants.
Starting from the top right and going clockwise, these quadrants are labeled as “LEADERS,” “WEAKENING,” “LAGGARDS,” and “IMPROVING.”
The “RRCSTATUS” function helps us figure out which quadrants a symbol falls into on the chart, and it gives us one of these labels like “LEADERS” or “LAGGARDS” to describe its position.
Line 7
Add Column RRCSTATUS a bar ago as PvsStatusThis line creates another column (“Add Column“) called “PvsStatus” and lists values of the “RRCSTATUS” function from one bar ago (“a bar ago“) into it. It helps in comparing the current status with its previous status.
The column title “PvsStatus” can be modified or personalized to your preference.
Line 8
Add Column RRCQUADRANT as Quad chartA new column named “Quad” is created (“Add Column“), and it contains information related to the stocks’ status or condition (“RRCQUADRANT“).
The “RRCQUADRANT” function helps us figure out which quadrant a symbol falls into on the Relative Rotational chart (RRC), and it gives us one of the labels like “Q2” (which is the same as LEADERS) or “Q4” (which is the same as LAGGARDS) to describe its position.
The function “chart” allows the RS-RATIO and RS-MOMENTUM indicators to be plotted an the chart should you open a symbol’s chart from within the scan results report.
The column title “Quad” can be modified or personalized to your preference.
Line 9
Add Column RRCQUADRANT a bar ago as QuadYest chartThis one creates a column (“Add Column“) called “QuadYest” and displays values of the “RRCQUADRANT” function from one bar ago (“a bar ago“) into it. This allows for comparisons between the current quadrant and the one from the previous bar.
The function “chart” allows the RS-RATIO and RS-MOMENTUM indicators to be plotted an the chart should you open a symbol’s chart from within the scan results report.
The column title “QuadYest” can be modified or personalized to your preference.
Line 10
Apply to NSEThe “Apply to …” function tells us that we’re applying these scan conditions to spot or cash stocks that are listed on the National Stock Exchange (“NSE“).
The Scan Report in ChartAlert