This functionality, pertaining to Relative Rotational Charts (RRC), was introduced in October 2023.
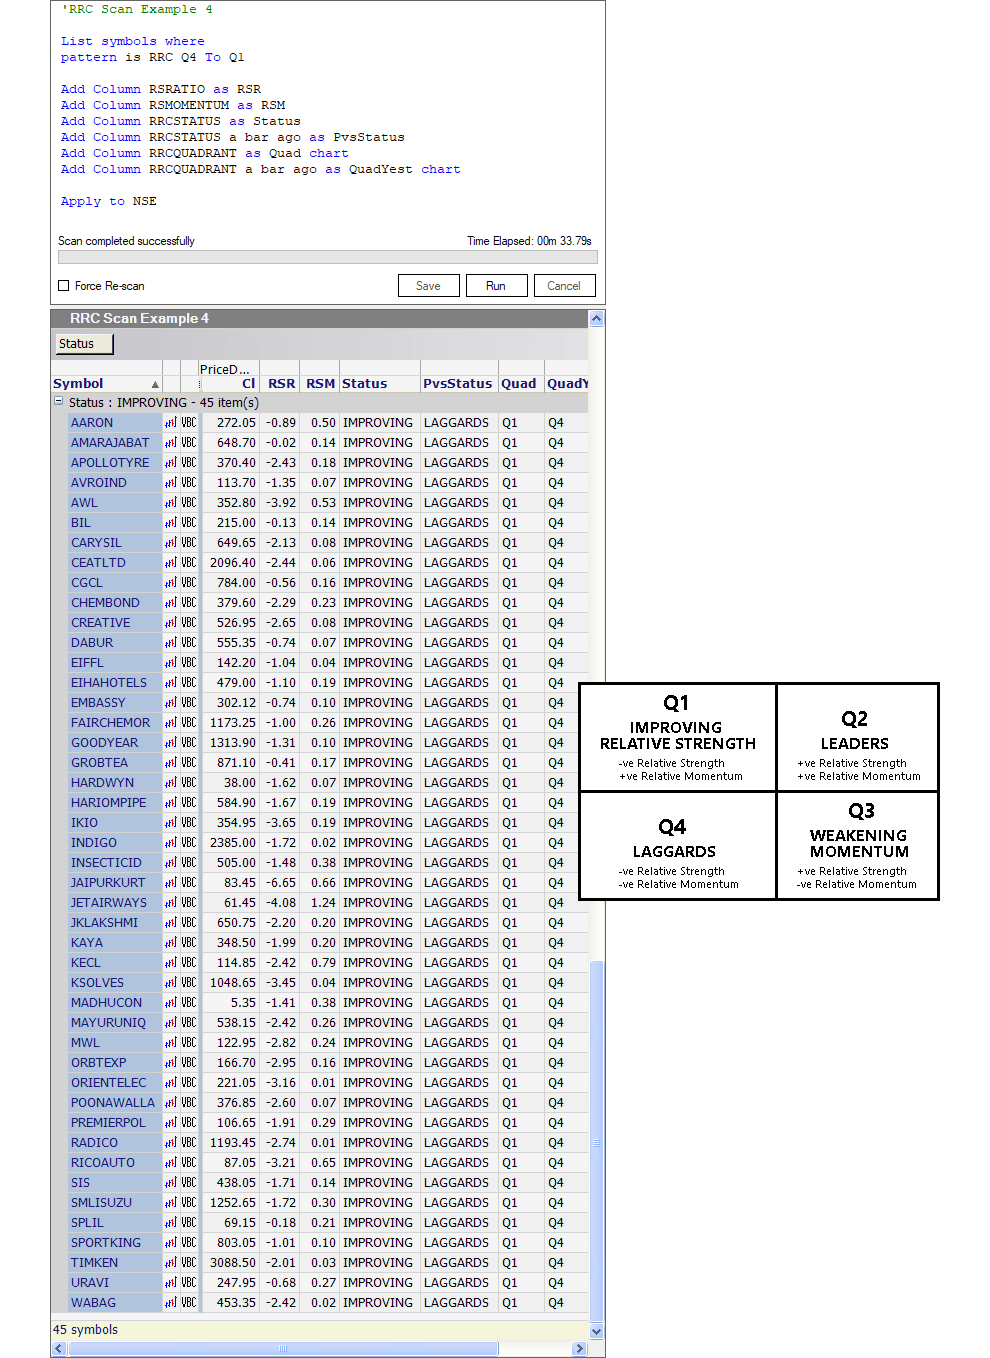
RRC Scan Example #4:
Identify stocks that are transitioning from one RRC quadrant to another
List symbols where
pattern is RRC Q4 To Q1

Add Column RSRATIO as RSR
Add Column RSMOMENTUM as RSM
Add Column RRCSTATUS as Status
Add Column RRCSTATUS a bar ago as PvsStatus
Add Column RRCQUADRANT as Quad chart
Add Column RRCQUADRANT a bar ago as QuadYest chart

Apply to NSE
Purpose of the Scan

The purpose of this scan is to identify stocks that exhibit or match a specific characteristic.
In the context of this scan, moving from one RRC quadrant (“Q4 or Laggard”) to another (“Q1 or Improving”).
Lines 1 and 2
List symbols where
pattern is RRC Q4 To Q1
The “List symbols where …” phrase is the function we use to establish the conditions for our search, and this function allows us to specify the criteria that stocks must meet in order to be included in the scan results.
In the current context, the phrase “Pattern is RRC Q4 To Q1” is a function that helps identify symbols that are transitioning from quadrant “Q4” (laggard stocks) to quadrant “Q1” (improving stocks).
Here, “Pattern is RRC” is used to identify specific patterns or conditions that are associated with sectoral rotation or Relative Rotational charts.
Line 3
Add Column RSRATIO as RSRThis line instructs the scan to create a column (“Add Column“) called “RSR” and list the values of the “RSRATIO” function into it. This is done to make it easier to work with the RSRATIO data.
The column title “RSR” can be modified or personalized to your preference.
What is “RSRATIO”?
The “RS-Ratio” indicator is a crucial input used in Relative Rotational charts (RRC).
It’s a valuable tool for assessing how strong or weak a symbol’s trend is compared to a benchmark index, like the Nifty.
If the RS-Ratio is above 0, it means the symbol is in an uptrend and is showing strength. If the ratio is below 0, it suggests a downtrend and indicates weakness.
Line 4
Add Column RSMOMENTUM as RSMSimilarly, this line creates a column (“Add Column“) called “RSM” and copies the values of the “RSMOMENTUM” function into it. Again, it’s for convenience and analysis.
The column title “RSM” can be modified or personalized to your preference.
What is “RSMOMENTUM”?
The “RS-Momentum” indicator, which is used in Relative Rotational charts (RRC), helps us understand how quickly the RS-Ratio indicator is changing.
In simpler terms, it tells us if the RS-Ratio is gaining or losing strength. Think of it as a kind of indicator for the main indicator.
The RS-Momentum moves up and down, oscillating around the 0 level.
Line 5
Add Column RRCSTATUS as StatusHere, a new column called “Status” is added (“Add Column“), and it contains information related to the stocks’ status or condition (“RRCSTATUS“) in the context of a Relative Rotational chart’s (RRC) scatter plot.
The column title “Status” can be modified or personalized to your preference.
What is “RRCSTATUS”?
Relative Rotational charts (RRC) are a visual tool for comparing how strong and fast a symbol is performing.
These charts have two lines, one going left to right (horizontal X-axis; the RS-Ratio) and one going up and down (vertical Y-axis; the RS-Momentum).
Where these lines cross at a point marked ‘0’ divides the chart into four quadrants.
Starting from the top right and going clockwise, these quadrants are labeled as “LEADERS,” “WEAKENING,” “LAGGARDS,” and “IMPROVING.”
The “RRCSTATUS” function helps us figure out which quadrants a symbol falls into on the chart, and it gives us one of these labels like “LEADERS” or “LAGGARDS” to describe its position.
Line 6
Add Column RRCSTATUS a bar ago as PvsStatusThis line creates another column (“Add Column“) called “PvsStatus” and lists values of the “RRCSTATUS” function from one bar ago (“a bar ago“) into it. It helps in comparing the current status with its previous status.
The column title “PvsStatus” can be modified or personalized to your preference.
Line 7
Add Column RRCQUADRANT as Quad chartA new column named “Quad” is created (“Add Column“), and it contains information related to the stocks’ status or condition (“RRCQUADRANT“).
The “RRCQUADRANT” function helps us figure out which quadrant a symbol falls into on the Relative Rotational chart (RRC), and it gives us one of the labels like “Q2” (which is the same as LEADERS) or “Q4” (which is the same as LAGGARDS) to describe its position.
The function “chart” allows the RS-RATIO and RS-MOMENTUM indicators to be plotted an the chart should you open a symbol’s chart from within the scan results report.
The column title “Quad” can be modified or personalized to your preference.
Line 8
Add Column RRCQUADRANT a bar ago as QuadYest chartThis one creates a column (“Add Column“) called “QuadYest” and displays values of the “RRCQUADRANT” function from one bar ago (“a bar ago“) into it. This allows for comparisons between the current quadrant and the one from the previous bar.
The function “chart” allows the RS-RATIO and RS-MOMENTUM indicators to be plotted an the chart should you open a symbol’s chart from within the scan results report.
The column title “QuadYest” can be modified or personalized to your preference.
Line 9
Apply to NSEThis “Apply to …” function tells the scan code to focus its search on spot or cash stocks that are listed on the National Stock Exchange (“NSE“).
The Scan Report in ChartAlert