This functionality was introduced in October 2023 (Version 23.10.1)
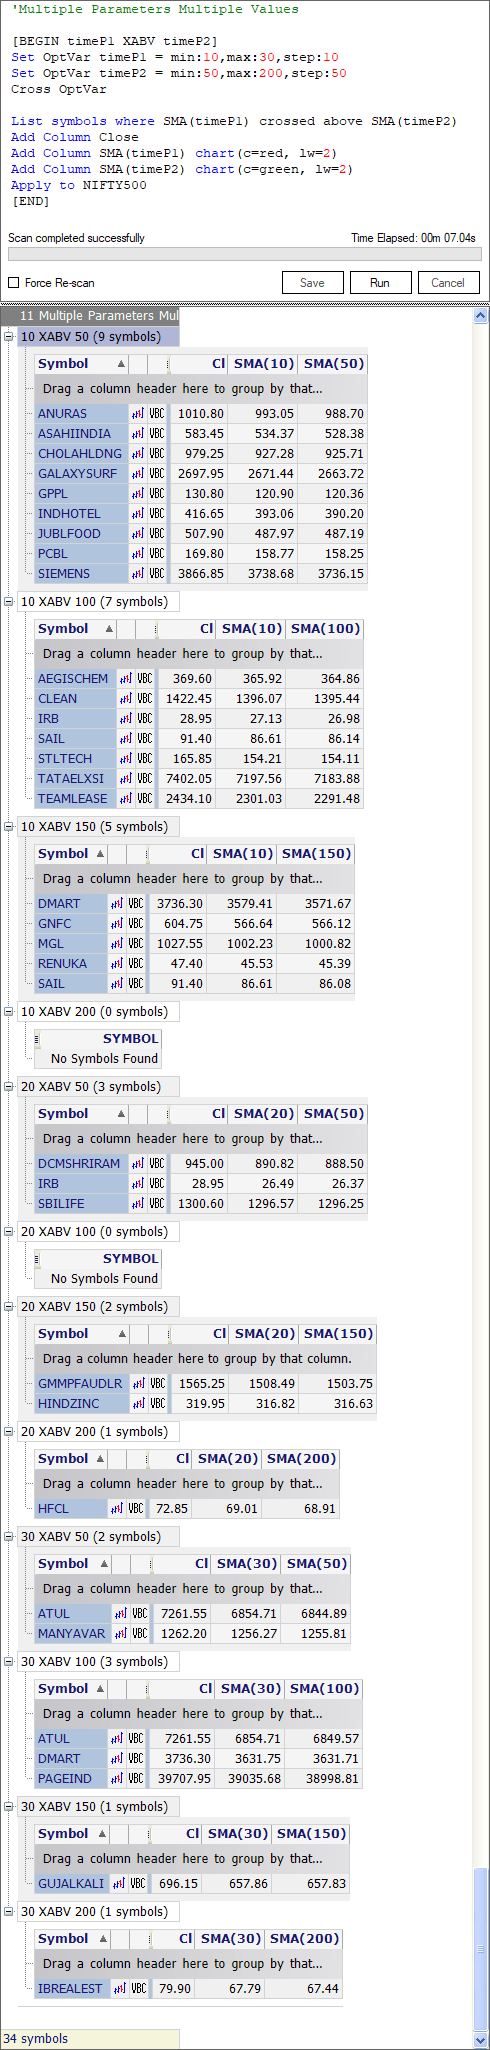
Below is an illustration of an optimized scan that can be created using the Advanced Scanner in ChartAlert.
This one enhanced scan, wherein multiple parameters/ variables can now accept multiple values/ inputs for scanning as well as create a processing matrix between inputs, now replaces the need for writing atleast twelve separate scans as was required in the previous versions of ChartAlert.
[BEGIN timeP1 XABV timeP2]

Set OptVar timeP1 = min:10,max:30,step:10
Set OptVar timeP2 = min:50,max:200,step:50

Cross OptVar

List symbols where SMA(timeP1) crossed above SMA(timeP2)

Add Column Close
Add Column SMA(timeP1) chart(c=red, lw=2)
Add Column SMA(timeP2) chart(c=green, lw=2)

Apply to NIFTY500

[END]
Below is a breakdown of the scan presented in a step-by-step manner.
Purpose of the Scan
- To generate a list of symbols where a faster SMA (Simple Moving Average) has just crossed above a slower SMA; the faster SMAs used are SMA(10), SMA(20) and SMA(30), while slower SMAs used are SMA(50), SMA(100), SMA(150) and SMA(200).
- To display the values of the latest Close, the faster SMAs and the slower SMAs in the scan results report.
- To scan the components of the following index: NIFTY500
- To plot the requisite SMAs on the chart if a symbol is opened from inside the scan results report.
Let’s go!
Line 1
[BEGIN timeP1 XABV timeP2]The optimized scan procedure starts with a “BEGIN” command.
The text “(timeP1)” and “(timeP2)” that comes after the “BEGIN” command serves as the designated heading for the scan results that will be showcased in the scan report.
See Line 2 and 3 below to know how “timeP1” and “timeP2” (eventually they will be associated with SMAs) will get used in the scan.
“timeP1 XABV timeP2” is designed to work like this: 20 XABV 100
Line 2 and 3
Set OptVar timeP1 = min:10,max:30,step:10
Set OptVar timeP2 = min:50,max:200,step:50
We are configuring or setting multiple optimized variables (“Set OptVar”) that will be referred to as “timeP1” and “timeP2”.
The variable “timeP1” (to be used in association with Simple Moving Average) will function as a temporary marker or placeholder within the scan heading and will be substituted with three input values like “10,” “20” and “30”.
Because the minimum input value is 10 (“min:10”), the maximum input value is 30 (“max:30”), and it will be stepped up in increments of 10 (“step:10”), the three inputs for “timeP1” will therefore be SMA(10), SMA(20) and SMA(30).
Similarly, the variable “timeP2” (to be used in association with Simple Moving Average) will function as a temporary marker or placeholder within the scan heading and will be substituted with four input values like “50,” “100,” “150” and “200”.
Because the minimum input value is 50 (“min:50”), the maximum input value is 200 (“max:200”), and it will be stepped up in increments of 50 (“step:50”), the four inputs for “timeP2” will therefore be SMA(50), SMA(100), SMA(150) and SMA(200).
You can customize both the terms “timeP1” and “timeP2” with anything of your choosing . . . Just remember to globally replace them for the scan to work.
See Line 5 below to know more on how “timeP1” and “timeP2” get used in the scan.
Line 4
Cross OptVarThe “Cross OptVar” is a function that will help set up a processing matrix between the two optimized variables, namely “timeP1” and “timeP2”.
Since the variable “timeP1” has three inputs (SMA(10), SMA(20) and SMA(30)), and the variable “timeP2” has four inputs (SMA(50), SMA(100), SMA(150) and SMA(200)), the “Cross OptVar” function will help set up a matrix of (“timeP1” x “timeP2”) (3 x 4) 12 inputs for scanning the data.
See Line 5 below for specific details.
Line 5
List symbols where SMA(timeP1) crossed above SMA(timeP2)This scan (“SMA(timeP1) crossed above SMA(timeP2)”) will generate a list of symbols where the faster Simple Moving Average (“SMA(timeP1)”) recently crossed above the slower Simple Moving Average (“SMA(timeP2)”).
Remember, the parameters/ variables “timeP1” and “timeP2” will encompass a processing matrix of (3 x 4) 12 inputs.
In essence, upon execution, this scanning process will look for symbols where the following conditions have been met:
1. SMA(10) crossed above SMA(50)
2. SMA(10) crossed above SMA(100)
3. SMA(10) crossed above SMA(150)
4. SMA(10) crossed above SMA(200)
5. SMA(20) crossed above SMA(50)
6. SMA(20) crossed above SMA(100)
7. SMA(20) crossed above SMA(150)
8. SMA(20) crossed above SMA(200)
9. SMA(30) crossed above SMA(50)
10. SMA(30) crossed above SMA(100)
11. SMA(30) crossed above SMA(150)
12. SMA(30) crossed above SMA(200)
Line 6, 7 and 8
Add Column Close
Add Column SMA(timeP1) chart(c=red, lw=2)
Add Column SMA(timeP2) chart(c=green, lw=2)
In this scan, the function “Add Column…” serves the purpose of displaying additional columns within a scan report.
In this case, the scanning report will display three columns: the latest closing value, the latest value of the faster SMA, and the latest value of the slower SMA.
These columns will be titled “Close,” “SMA(timeP1)” and “SMA(timeP2)”, respectively.
The function “chart(c=red, lw=2)” will plot the faster SMA on the chart of the resultant symbol in ChartAlert, and the color and the line width of the moving average would be set to “red” and at “2” pixels (respectively).
The function “chart(c=green, lw=2)” will plot the faster SMA on the chart, and the color and the line width of the moving average would be set to “green” and at “2” pixels (respectively).
Line 9
Apply to NIFTY500The “Apply to…” function applies the scanning process to the NIFTY500 Index, and the scan will effectively examine all the constituent elements of NIFTY500.
Line 10
[END]The optimized scan code concludes with an “END” statement.
The Scan Report in ChartAlert