This functionality, pertaining to Relative Rotational Charts (RRC), was introduced in October 2023.
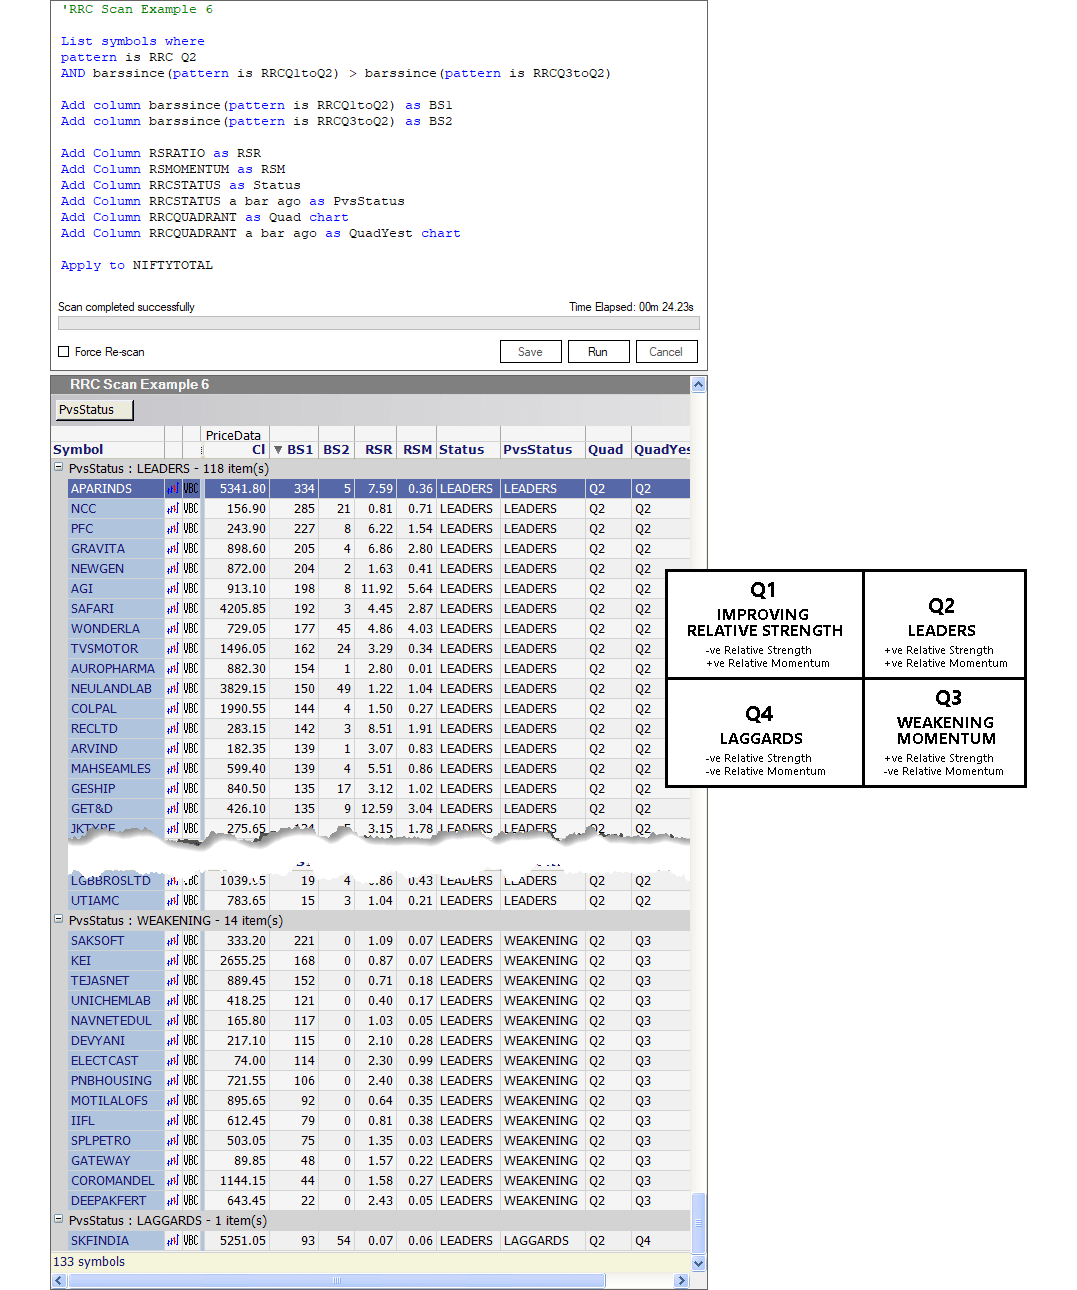
RRC Scan Example #6:
Look for stocks that are currently present in a particular quadrant, and for how long they have been present there, by checking for a specific timing condition and then filtering the results
List symbols where
pattern is RRC Q2
AND barssince(pattern is RRCQ1toQ2) > barssince(pattern is RRCQ3toQ2)

Add column barssince(pattern is RRCQ1toQ2) as BS1
Add column barssince(pattern is RRCQ3toQ2) as BS2

Add Column RSRATIO as RSR
Add Column RSMOMENTUM as RSM
Add Column RRCSTATUS as Status
Add Column RRCSTATUS a bar ago as PvsStatus
Add Column RRCQUADRANT as Quad chart
Add Column RRCQUADRANT a bar ago as QuadYest chart

Apply to NIFTYTOTAL
Purpose of the Scan
The purpose of this scan code is to look for NIFTYTOTAL component stocks that are currently present in a particular quadrant (“RRC Q2”), and for how long they have been present in that quadrant.

This will be done by checking for a specific timing condition (BS1 > BS2) and then filtering the results.
One of the timing condition (“BS1”) looks for how long ago did a symbol move from quadrant Q1 to Q2, and the other timing condition (“BS2”) looks for how long ago did a symbol move from quadrant Q3 to Q2.
It will also display the number of bars since the occurrence of two different events (“RRCQ1toQ2” and “RRCQ3toQ2”) for those qualifying stocks.
Lines 1 through 3
List symbols where
pattern is RRC Q2
AND barssince(pattern is RRCQ1toQ2) > barssince(pattern is RRCQ3toQ2)
The “List symbols where …” function establishes a condition that stocks must meet in order to be included in the scan results.
The “pattern is RRC Q2” function looks for symbols that are presently residing in the RRC Q2 quadrant. Please note that the Q2 quadrant is where leaders or stocks outperforming the underlying benchmark (say, NIFTY) reside.
What are we trying to achieve with this scan?
In general, stocks can enter quadrant Q2 (Leaders) in two ways.
First, they can shift from quadrant Q1 (Improving Relative Strength), which signifies that the stock used to perform worse than a benchmark index but is now doing better.
Second, they can move from quadrant Q3 (Outperformer but with Weakening Momentum), indicating that the stock was a good performer but recently had a period of weaker performance, and it’s now regaining momentum.
With this scan code, we aim to identify symbols that have recently shifted from quadrants Q1 to Q2. The goal is to identify these symbols by comparing the time elapsed since they moved from quadrants Q1 to Q2 with the time elapsed since they shifted from quadrants Q3 to Q2.
If the time since the shift from quadrants Q1 to Q2 is greater than the time since the shift from quadrants Q3 to Q2, it suggests that these symbols have recently started outperforming the benchmark index.
The “pattern is RRCQ1toQ2” function looks for *when* the stocks newly moved into the RRC Q2 quadrant from the Q1 quadrant (Improving Relative Strength), while the “pattern is RRCQ3toQ2” function looks for *when* the stocks newly moved into the RRC Q2 quadrant from the Q3 quadrant (Weakening Relative Momentum).
The “barssince(pattern is RRCQ1toQ2)” function computes the number of bars (time elapsed) since the event “pattern is RRCQ1toQ2”, and the “barssince(pattern is RRCQ3toQ2)” function computes the number of bars since the event “pattern is RRCQ3toQ2”.
Then, the scan code will compare the number of bars (a unit of time in trading) since the “RRCQ1toQ2” pattern occurred to the number of bars since the “RRCQ3toQ2” pattern occurred, and will only consider those stocks where the number of bars since “RRCQ1toQ2” is greater than the number of bars since “RRCQ3toQ2.”
Lines 4 and 5
Add column barssince(pattern is RRCQ1toQ2) as BS1
Add column barssince(pattern is RRCQ3toQ2) as BS2
The scan will create a new column (“Add Column“) called “BS1” in the scan results table. It will show the number of bars since the “RRCQ1toQ2” event occurred for each stock that meets the criteria.
Similarly to the previous step, the scan will create another new column called “BS2” in the scan results table. It will display the number of bars since the “RRCQ3toQ2” event occurred for each qualifying stock.
The column titles “BS1” and “BS2″can be modified or personalized to your preference.
Line 6
Add Column RSRATIO as RSRThis line instructs the scan to create a column (“Add Column“) called “RSR” and list the values of the “RSRATIO” function into it. This is done to make it easier to work with the RSRATIO data.
The column title “RSR” can be modified or personalized to your preference.
What is “RSRATIO”?
The “RS-Ratio” indicator is a crucial input used in Relative Rotational charts (RRC).
It’s a valuable tool for assessing how strong or weak a symbol’s trend is compared to a benchmark index, like the Nifty.
If the RS-Ratio is above 0, it means the symbol is in an uptrend and is showing strength. If the ratio is below 0, it suggests a downtrend and indicates weakness.
Line 7
Add Column RSMOMENTUM as RSMSimilarly, this line creates a column (“Add Column“) called “RSM” and copies the values of the “RSMOMENTUM” function into it. Again, it’s for convenience and analysis.
The column title “RSM” can be modified or personalized to your preference.
What is “RSMOMENTUM”?
The “RS-Momentum” indicator, which is used in Relative Rotational charts (RRC), helps us understand how quickly the RS-Ratio indicator is changing.
In simpler terms, it tells us if the RS-Ratio is gaining or losing strength. Think of it as a kind of indicator for the main indicator.
The RS-Momentum moves up and down, oscillating around the 0 level.
Line 8
Add Column RRCSTATUS as StatusHere, a new column called “Status” is added (“Add Column“), and it contains information related to the stocks’ status or condition (“RRCSTATUS“) in the context of a Relative Rotational chart’s (RRC) scatter plot.
The column title “Status” can be modified or personalized to your preference.
What is “RRCSTATUS”?
Relative Rotational charts (RRC) are a visual tool for comparing how strong and fast a symbol is performing.
These charts have two lines, one going left to right (horizontal X-axis; the RS-Ratio) and one going up and down (vertical Y-axis; the RS-Momentum).
Where these lines cross at a point marked ‘0’ divides the chart into four quadrants.
Starting from the top right and going clockwise, these quadrants are labeled as “LEADERS,” “WEAKENING,” “LAGGARDS,” and “IMPROVING.”
The “RRCSTATUS” function helps us figure out which quadrants a symbol falls into on the chart, and it gives us one of these labels like “LEADERS” or “LAGGARDS” to describe its position.
Line 9
Add Column RRCSTATUS a bar ago as PvsStatusThis line creates another column (“Add Column“) called “PvsStatus” and lists values of the “RRCSTATUS” function from one bar ago (“a bar ago“) into it. It helps in comparing the current status with its previous status.
The column title “PvsStatus” can be modified or personalized to your preference.
Line 10
Add Column RRCQUADRANT as Quad chartA new column named “Quad” is created (“Add Column“), and it contains information related to the stocks’ status or condition (“RRCQUADRANT“).
The “RRCQUADRANT” function helps us figure out which quadrant a symbol falls into on the Relative Rotational chart (RRC), and it gives us one of the labels like “Q2” (which is the same as LEADERS) or “Q4” (which is the same as LAGGARDS) to describe its position.
The function “chart” allows the RS-RATIO and RS-MOMENTUM indicators to be plotted an the chart should you open a symbol’s chart from within the scan results report.
The column title “Quad” can be modified or personalized to your preference.
Line 11
Add Column RRCQUADRANT a bar ago as QuadYest chartThis one creates a column (“Add Column“) called “QuadYest” and displays values of the “RRCQUADRANT” function from one bar ago (“a bar ago“) into it. This allows for comparisons between the current quadrant and the one from the previous bar.
The function “chart” allows the RS-RATIO and RS-MOMENTUM indicators to be plotted an the chart should you open a symbol’s chart from within the scan results report.
The column title “QuadYest” can be modified or personalized to your preference.
Line 12
Apply to NIFTYTOTALFinally, the “Apply to …” function specifies the scan to be applied to a specific group of stocks that make up the “NIFTYTOTAL” Index.
The Scan Report in ChartAlert