This functionality, pertaining to Relative Rotational Charts (RRC), was introduced in October 2023.
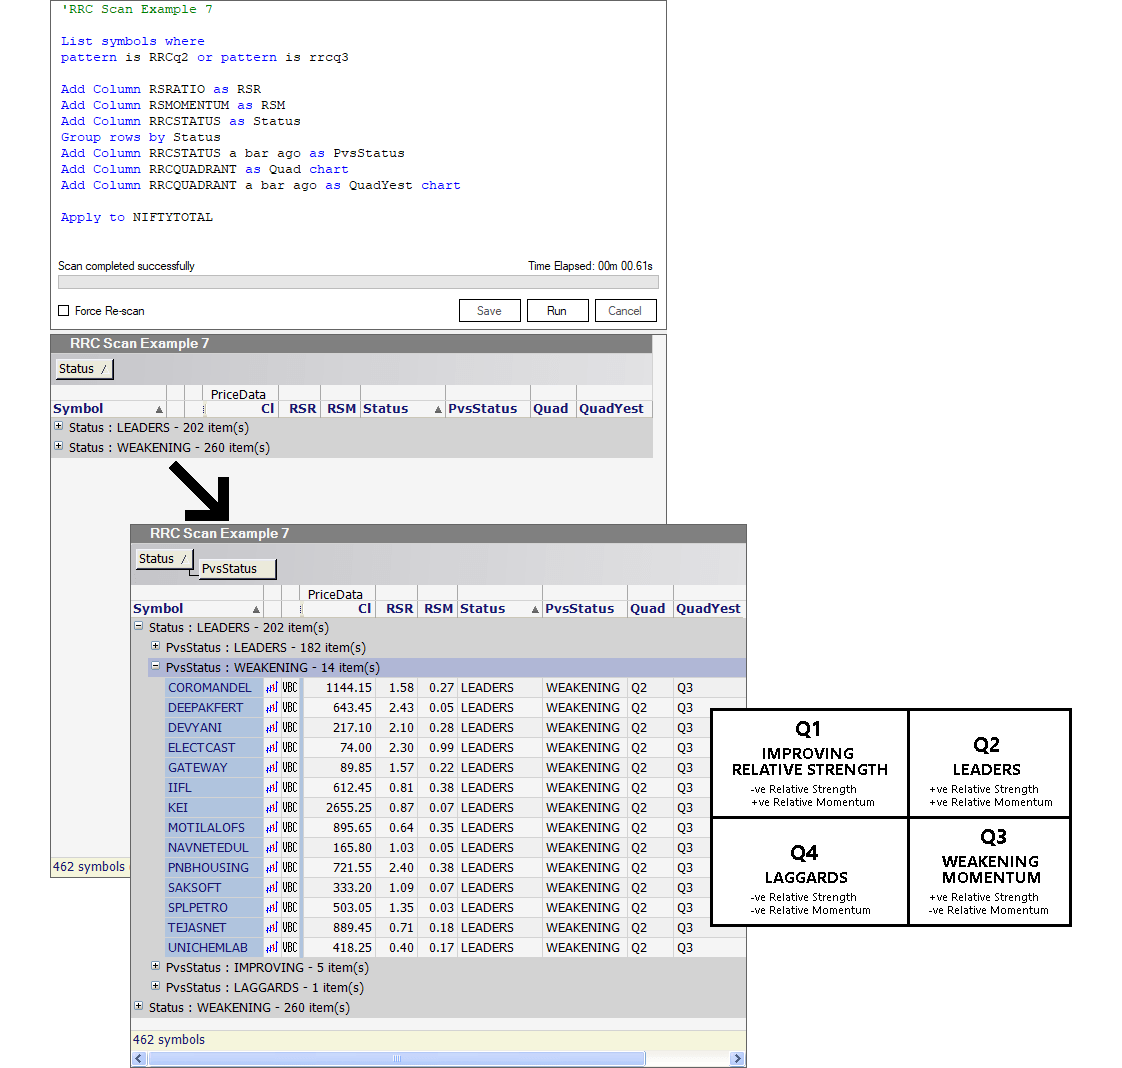
RRC Scan Example #7:
Look for stocks that are currently present in a particular quadrant, add new columns and group them by the RRC status.
List symbols where
pattern is RRCq2 or pattern is rrcq3

Add Column RSRATIO as RSR
Add Column RSMOMENTUM as RSM
Add Column RRCSTATUS as Status
Group rows by Status
Add Column RRCSTATUS a bar ago as PvsStatus
Add Column RRCQUADRANT as Quad chart
Add Column RRCQUADRANT a bar ago as QuadYest chart

Apply to NIFTYTOTAL
Purpose of the Scan

The purpose of this scan code is to look for NIFTYTOTAL component stocks that are currently present in a particular quadrant (“RRC Q2 or Q3”).
These are symbols that are outperforming an underlying benchmark index, but with waxing or waning momentum.
The scan code will also add new columns to store data about them, group them by their RRC status, and track changes in the status.
Lines 1 and 2
List symbols where
pattern is RRCq2 or pattern is rrcq3
The first line (“List symbols where …“) tells the scan code to start looking for stocks that meet certain conditions.
The scan code has been designed to check for a specific condition related to stocks (“Pattern is RRCq2 or pattern is rrcq3“). That is, it’s looking for stocks that fall into one of two quadrants: “RRCq2” or “rrcq3“.
“RRCq2” represents a quadrant called “RRC Q2,” where you can find “Leaders.” These are stocks that have shown positive relative strength, meaning they perform better than the benchmark index, and they also have positive relative momentum.
“rrcq3” stands for “RRC Q3,” which is the quadrant for “Outperformers with Weakening Momentum.” In this category, you find stocks with positive relative strength (again, outperforming the benchmark index), but they have negative relative momentum, which means their recent performance has been slowing down.
In simpler terms, this scan is looking for two types of stocks: strong performers with positive momentum, or strong performers whose momentum is slowing down.
Line 3
Add Column RSRATIO as RSRThis line instructs the scan to create a column (“Add Column“) called “RSR” and list the values of the “RSRATIO” function into it. This is done to make it easier to work with the RSRATIO data.
The column title “RSR” can be modified or personalized to your preference.
What is “RSRATIO”?
The “RS-Ratio” indicator is a crucial input used in Relative Rotational charts (RRC).
It’s a valuable tool for assessing how strong or weak a symbol’s trend is compared to a benchmark index, like the Nifty.
If the RS-Ratio is above 0, it means the symbol is in an uptrend and is showing strength. If the ratio is below 0, it suggests a downtrend and indicates weakness.
Line 4
Add Column RSMOMENTUM as RSMSimilarly, this line creates a column (“Add Column“) called “RSM” and copies the values of the “RSMOMENTUM” function into it. Again, it’s for convenience and analysis.
The column title “RSM” can be modified or personalized to your preference.
What is “RSMOMENTUM”?
The “RS-Momentum” indicator, which is used in Relative Rotational charts (RRC), helps us understand how quickly the RS-Ratio indicator is changing.
In simpler terms, it tells us if the RS-Ratio is gaining or losing strength. Think of it as a kind of indicator for the main indicator.
The RS-Momentum moves up and down, oscillating around the 0 level.
Lines 5 and 6
Add Column RRCSTATUS as Status
Group rows by Status
In this context, a new piece of information is being introduced within the dataset (“Add Column“), denoted by a column named “Status.” This column is designed to provide insights into the status or condition of various stocks, specifically in relation to their position on a Relative Rotational chart (RRC) scatter plot, as indicated by the “RRCSTATUS.”
The title of this column, “Status,” can be customized according to your preferences if needed.
Furthermore, the “Group rows by…” function serves the purpose of instructing the scan code to organize and group the results of the scan based on a specific column. In this particular case, the scan results will be grouped according to the values found in the “Status” column, which contains information regarding the “RRCSTATUS” of the qualifying symbols.
What is “RRCSTATUS”?
Relative Rotational charts (RRC) are a visual tool for comparing how strong and fast a symbol is performing.
These charts have two lines, one going left to right (horizontal X-axis; the RS-Ratio) and one going up and down (vertical Y-axis; the RS-Momentum).
Where these lines cross at a point marked ‘0’ divides the chart into four quadrants.
Starting from the top right and going clockwise, these quadrants are labeled as “LEADERS,” “WEAKENING,” “LAGGARDS,” and “IMPROVING.”
The “RRCSTATUS” function helps us figure out which quadrants a symbol falls into on the chart, and it gives us one of these labels like “LEADERS” or “LAGGARDS” to describe its position.
Line 7
Add Column RRCSTATUS a bar ago as PvsStatusThis line creates another column (“Add Column“) called “PvsStatus” and lists values of the “RRCSTATUS” function from one bar ago (“a bar ago“) into it. It helps in comparing the current status with its previous status.
The column title “PvsStatus” can be modified or personalized to your preference.
Line 8
Add Column RRCQUADRANT as Quad chartA new column named “Quad” is created (“Add Column“), and it contains information related to the stocks’ status or condition (“RRCQUADRANT“).
The “RRCQUADRANT” function helps us figure out which quadrant a symbol falls into on the Relative Rotational chart (RRC), and it gives us one of the labels like “Q2” (which is the same as LEADERS) or “Q4” (which is the same as LAGGARDS) to describe its position.
The function “chart” allows the RS-RATIO and RS-MOMENTUM indicators to be plotted an the chart should you open a symbol’s chart from within the scan results report.
The column title “Quad” can be modified or personalized to your preference.
Line 9
Add Column RRCQUADRANT a bar ago as QuadYest chartThis one creates a column (“Add Column“) called “QuadYest” and displays values of the “RRCQUADRANT” function from one bar ago (“a bar ago“) into it. This allows for comparisons between the current quadrant and the one from the previous bar.
The function “chart” allows the RS-RATIO and RS-MOMENTUM indicators to be plotted an the chart should you open a symbol’s chart from within the scan results report.
The column title “QuadYest” can be modified or personalized to your preference.
Line 10
Apply to NIFTYTOTALFinally, the “Apply to …” function specifies the scan to be applied to a specific group of stocks that make up the “NIFTYTOTAL” Index.
The Scan Report in ChartAlert