This functionality, pertaining to Relative Rotational Charts (RRC), was introduced in October 2023.
RRC Scan Example #11:
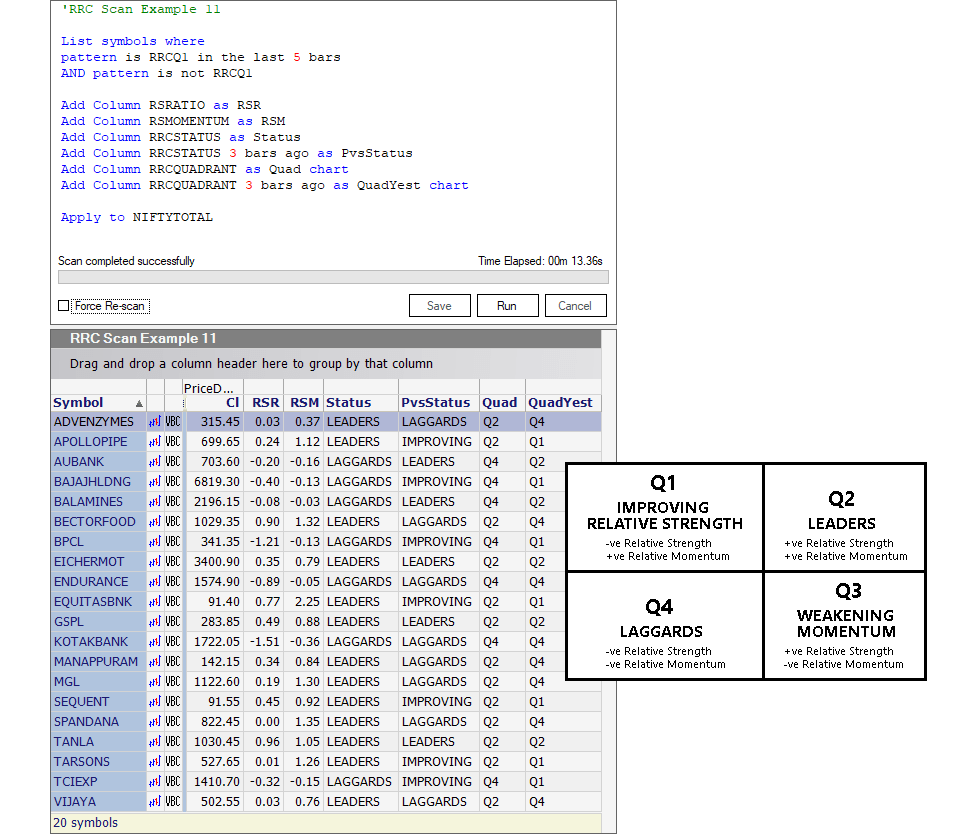
Looking for stocks that were recently in quadrant Q1 but are no longer there today
List symbols where
pattern is RRCQ1 in the last 5 bars
AND pattern is not RRCQ1

Add Column RSRATIO as RSR
Add Column RSMOMENTUM as RSM
Add Column RRCSTATUS as Status
Add Column RRCSTATUS 3 bars ago as PvsStatus
Add Column RRCQUADRANT as Quad chart
Add Column RRCQUADRANT 3 bars ago as QuadYest chart

Apply to NIFTYTOTAL
Purpose of the Scan

The purpose of this scan is to search for stocks within the NIFTYTOTAL Index.
Specifically, the scan code is looking for stocks that were previously in a quadrant referred to as “RRCQ1” but are no longer categorized as such.
To put it simply, it’s like looking for a specific type of fish in a big pond and making sure they used to be there but aren’t there anymore today.
Lines 1 through 3
List symbols where
pattern is RRCQ1 in the last 5 bars
AND pattern is not RRCQ1
The “List symbols where …” function instructs the scanning code to examine a list of stock symbols with the aim of identifying specific characteristics about them.
The “pattern is RRCQ1 in the last 5 bars” function is designed to locate stocks that were positioned in the RRC quadrant labeled “Q1” during the most recent 5 days of trading, which essentially covers the past week.
Following the identification of stocks that were previously located in the RRC quadrant “Q1” (stocks with improving relative strength) during the last 5 days, the “AND pattern is not RRCQ1” function ensures that these same stocks are currently not within that quadrant today. In essence, it’s a search for stocks that were once situated in that quadrant but have since moved out of it.
Typically, when stocks move out of the RRC quadrant Q1, they tend to do one of two things: they either move into quadrant Q2 (indicating they are leaders with strong relative strength and momentum) or they move into quadrant Q4 (indicating they are laggards or underperforming stocks with negative relative momentum). This movement is often influenced by the overall market sentiment at the time.
Line 4
Add Column RSRATIO as RSRThis line instructs the scan to create a column (“Add Column“) called “RSR” and list the values of the “RSRATIO” function into it. This is done to make it easier to work with the RSRATIO data.
The column title “RSR” can be modified or personalized to your preference.
What is “RSRATIO”?
The “RS-Ratio” indicator is a crucial input used in Relative Rotational charts (RRC).
It’s a valuable tool for assessing how strong or weak a symbol’s trend is compared to a benchmark index, like the Nifty.
If the RS-Ratio is above 0, it means the symbol is in an uptrend and is showing strength. If the ratio is below 0, it suggests a downtrend and indicates weakness.
Line 5
Add Column RSMOMENTUM as RSMSimilarly, this line creates a column (“Add Column“) called “RSM” and copies the values of the “RSMOMENTUM” function into it. Again, it’s for convenience and analysis.
The column title “RSM” can be modified or personalized to your preference.
What is “RSMOMENTUM”?
The “RS-Momentum” indicator, which is used in Relative Rotational charts (RRC), helps us understand how quickly the RS-Ratio indicator is changing.
In simpler terms, it tells us if the RS-Ratio is gaining or losing strength. Think of it as a kind of indicator for the main indicator.
The RS-Momentum moves up and down, oscillating around the 0 level.
Line 6
Add Column RRCSTATUS as StatusHere, a new column called “Status” is added (“Add Column“), and it contains information related to the stocks’ status or condition (“RRCSTATUS“) in the context of a Relative Rotational chart’s (RRC) scatter plot.
The column title “Status” can be modified or personalized to your preference.
What is “RRCSTATUS”?
Relative Rotational charts (RRC) are a visual tool for comparing how strong and fast a symbol is performing.
These charts have two lines, one going left to right (horizontal X-axis; the RS-Ratio) and one going up and down (vertical Y-axis; the RS-Momentum).
Where these lines cross at a point marked ‘0’ divides the chart into four quadrants.
Starting from the top right and going clockwise, these quadrants are labeled as “LEADERS,” “WEAKENING,” “LAGGARDS,” and “IMPROVING.”
The “RRCSTATUS” function helps us figure out which quadrants a symbol falls into on the chart, and it gives us one of these labels like “LEADERS” or “LAGGARDS” to describe its position.
Line 7
Add Column RRCSTATUS a bar ago as PvsStatusThis line creates another column (“Add Column“) called “PvsStatus” and lists values of the “RRCSTATUS” function from one bar ago (“a bar ago“) into it. It helps in comparing the current status with its previous status.
The column title “PvsStatus” can be modified or personalized to your preference.
Line 8
Add Column RRCQUADRANT as Quad chartA new column named “Quad” is created (“Add Column“), and it contains information related to the stocks’ status or condition (“RRCQUADRANT“).
The “RRCQUADRANT” function helps us figure out which quadrant a symbol falls into on the Relative Rotational chart (RRC), and it gives us one of the labels like “Q2” (which is the same as LEADERS) or “Q4” (which is the same as LAGGARDS) to describe its position.
The function “chart” allows the RS-RATIO and RS-MOMENTUM indicators to be plotted an the chart should you open a symbol’s chart from within the scan results report.
The column title “Quad” can be modified or personalized to your preference.
Line 9
Add Column RRCQUADRANT a bar ago as QuadYest chartThis one creates a column (“Add Column“) called “QuadYest” and displays values of the “RRCQUADRANT” function from one bar ago (“a bar ago“) into it. This allows for comparisons between the current quadrant and the one from the previous bar.
The function “chart” allows the RS-RATIO and RS-MOMENTUM indicators to be plotted an the chart should you open a symbol’s chart from within the scan results report.
The column title “QuadYest” can be modified or personalized to your preference.
Line 10
Apply to NIFTYTOTALFinally, the “Apply to …” function specifies the scan to be applied to a specific group of stocks that make up the “NIFTYTOTAL” Index.
The Scan Report in ChartAlert