This functionality, pertaining to Relative Rotational Charts (RRC), was introduced in October 2023.
RRC Scan Example #12:
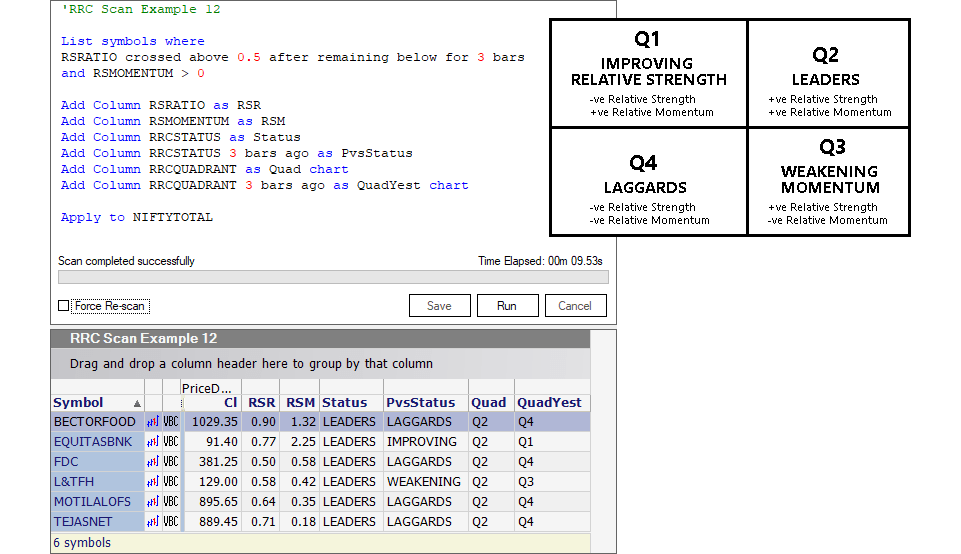
Identify symbols that are getting relatively stronger and have positive momentum
List symbols where
RSRATIO crossed above 0.5 after remaining below for 3 bars
and RSMOMENTUM > 0

Add Column RSRATIO as RSR
Add Column RSMOMENTUM as RSM
Add Column RRCSTATUS as Status
Add Column RRCSTATUS 3 bars ago as PvsStatus
Add Column RRCQUADRANT as Quad chart
Add Column RRCQUADRANT 3 bars ago as QuadYest chart

Apply to NIFTYTOTAL
Purpose of the Scan

The purpose of this scan is to help us identify potentially interesting symbols that makeup the NIFTYTOTAL Index and are getting relatively stronger (RSRATIO crossed above 0.5) and have positive momentum (RSMOMENTUM > 0).
The filtering function “after remaining below for 3 bars” ensures that the symbols have not been whipsawing around the 0.5 value.
The objective is achieved by using raw input functions of the Relative Rotational charts (RRC) feature.
Lines 1 through 3
List symbols where
RSRATIO crossed above 0.5 after remaining below for 3 bars
and RSMOMENTUM > 0
The “List symbols where …” function instructs the scanning code to examine a list of stock symbols with the aim of identifying specific conditions about them.
The first criteria involves a condition referred to as “RSRATIO crossed above 0.5 after remaining below for 3 bars.” It’s important to note that “crossed above” and “after remaining below for n bars” are specialized functions within our advanced scanning tool.
Now, let’s clarify what we mean by “RSRATIO.” This is a metric we employ to assess how strong a particular stock is in comparison to a reference benchmark Index. Think of it like a line graph representing the “RSRATIO.” When this line rises above 0.5 after consistently having remained below it for the previous 3 bars (or time intervals), it piques our interest regarding that particular stock.
The second criterion entails checking whether “RSMOMENTUM > 0,” which means that “RSMOMENTUM” is presently higher than zero.
“RSMOMENTUM” is a different metric that helps us gauge if a stock is currently exhibiting positive momentum relative to the referenced benchmark Index.
In more straightforward language, we are seeking symbols that are currently moving in a positive direction.
What is “RSRATIO”?
The “RS-Ratio” indicator is a crucial input used in Relative Rotational charts (RRC).
It’s a valuable tool for assessing how strong or weak a symbol’s trend is compared to a benchmark index, like the Nifty.
If the RS-Ratio is above 0, it means the symbol is in an uptrend and is showing strength. If the ratio is below 0, it suggests a downtrend and indicates weakness.
What is “RSMOMENTUM”?
The “RS-Momentum” indicator, which is used in Relative Rotational charts (RRC), helps us understand how quickly the RS-Ratio indicator is changing.
In simpler terms, it tells us if the RS-Ratio is gaining or losing strength. Think of it as a kind of indicator for the main indicator.
The RS-Momentum moves up and down, oscillating around the 0 level.
Line 4
Add Column RSRATIO as RSRThis line instructs the scan to create a column (“Add Column“) called “RSR” and list the values of the “RSRATIO” function into it. This is done to make it easier to work with the RSRATIO data.
The column title “RSR” can be modified or personalized to your preference.
Line 5
Add Column RSMOMENTUM as RSMSimilarly, this line creates a column (“Add Column“) called “RSM” and copies the values of the “RSMOMENTUM” function into it. Again, it’s for convenience and analysis.
The column title “RSM” can be modified or personalized to your preference.
Line 6
Add Column RRCSTATUS as StatusHere, a new column called “Status” is added (“Add Column“), and it contains information related to the stocks’ status or condition (“RRCSTATUS“) in the context of a Relative Rotational chart’s (RRC) scatter plot.
The column title “Status” can be modified or personalized to your preference.
What is “RRCSTATUS”?
Relative Rotational charts (RRC) are a visual tool for comparing how strong and fast a symbol is performing.
These charts have two lines, one going left to right (horizontal X-axis; the RS-Ratio) and one going up and down (vertical Y-axis; the RS-Momentum).
Where these lines cross at a point marked ‘0’ divides the chart into four quadrants.
Starting from the top right and going clockwise, these quadrants are labeled as “LEADERS,” “WEAKENING,” “LAGGARDS,” and “IMPROVING.”
The “RRCSTATUS” function helps us figure out which quadrants a symbol falls into on the chart, and it gives us one of these labels like “LEADERS” or “LAGGARDS” to describe its position.
Line 7
Add Column RRCSTATUS a bar ago as PvsStatusThis line creates another column (“Add Column“) called “PvsStatus” and lists values of the “RRCSTATUS” function from one bar ago (“a bar ago“) into it. It helps in comparing the current status with its previous status.
The column title “PvsStatus” can be modified or personalized to your preference.
Line 8
Add Column RRCQUADRANT as Quad chartA new column named “Quad” is created (“Add Column“), and it contains information related to the stocks’ status or condition (“RRCQUADRANT“).
The “RRCQUADRANT” function helps us figure out which quadrant a symbol falls into on the Relative Rotational chart (RRC), and it gives us one of the labels like “Q2” (which is the same as LEADERS) or “Q4” (which is the same as LAGGARDS) to describe its position.
The function “chart” allows the RS-RATIO and RS-MOMENTUM indicators to be plotted an the chart should you open a symbol’s chart from within the scan results report.
The column title “Quad” can be modified or personalized to your preference.
Line 9
Add Column RRCQUADRANT a bar ago as QuadYest chartThis one creates a column (“Add Column“) called “QuadYest” and displays values of the “RRCQUADRANT” function from one bar ago (“a bar ago“) into it. This allows for comparisons between the current quadrant and the one from the previous bar.
The function “chart” allows the RS-RATIO and RS-MOMENTUM indicators to be plotted an the chart should you open a symbol’s chart from within the scan results report.
The column title “QuadYest” can be modified or personalized to your preference.
Line 10
Apply to NIFTYTOTALFinally, the “Apply to …” function specifies the scan to be applied to a specific group of stocks that make up the “NIFTYTOTAL” Index. This means we’re looking for these conditions within the NIFTYTOTAL stock list.
The Scan Report in ChartAlert