
The Rising Wedge is a bearish reversal chart pattern characterized by converging trendlines sloping upward. It signals weakening buying pressure and a potential downward breakout, making it a crucial tool for traders and investors.
Did you know ChartAlert can detect and scan for classical Chart Patterns? Click here to see how to use this feature in ChartAlert.
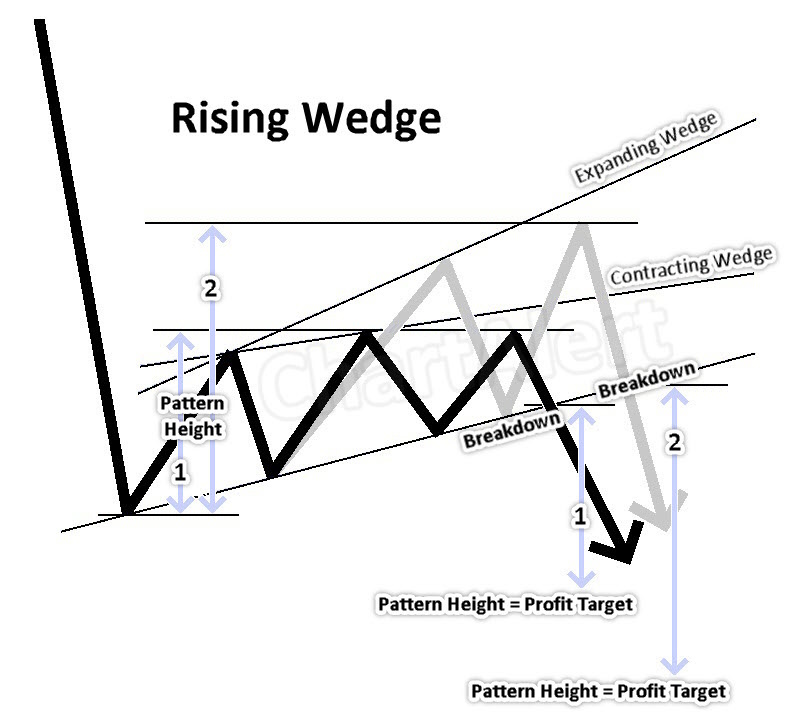
Understanding the Rising Wedge (Diagonal) Classical Chart Pattern
The Rising Wedge is a well-known pattern in technical analysis that appears during uptrends. Despite rising prices, the narrowing structure reflects a gradual loss of bullish momentum. This pattern often leads to a breakdown, signaling a potential bearish reversal.
Why Does This Pattern Form?
- Strong Initial Uptrend – Buyers push prices higher, creating optimism in the market.
- Converging Trendlines – Higher highs and higher lows form, but the pace of gains slows, revealing reduced buyer enthusiasm.
- Weakening Momentum – Sellers begin entering the market, leading to a tightening price range.
- Breakout Decision Point – As the pattern narrows, a downside breakout is more likely due to increasing selling pressure.
- Bearish Reversal – Once price breaks below the lower trendline, it signals the start of a potential downtrend.
Market Psychology Behind the Rising Wedge
Fear-Induced Breakout: Once support is broken, stop-loss orders get triggered, fueling a rapid sell-off. The emotional shift from optimism to fear amplifies the bearish movement.
Trapped Bulls: Traders who entered long positions earlier in the uptrend may start feeling trapped as momentum slows. This creates hesitation and uncertainty.
False Optimism: Despite making higher highs, the fact that they are rising at a decreasing rate suggests that bullish conviction is weakening.
Sellers Seizing Control: The pattern reflects growing selling interest. As more sellers enter the market, the bid-ask spread narrows, and buyers struggle to push prices significantly higher.
For customizable Rising Wedge classical chart pattern factory scans that can be edited, modified or revised, and subsequently scanned through ChartAlert’s native stock screener or technical analysis scanner, click here.
How to Trade the Rising Wedge (Diagonal) Classical Chart Pattern
Identifying and trading the Rising Wedge effectively requires patience and confirmation. Here’s how:
Step 1: Identify the Pattern
- Look for a wedge-shaped structure with higher highs and higher lows.
- Trendlines should converge, with the upper trendline steeper than the lower one.
- The formation should take place over a reasonable duration; shorter timeframes may yield false signals.
Step 2: Confirm the Pattern
- Ensure at least three touches on both the upper and lower trendlines.
- Declining volume can further confirm the weakening bullish momentum.
- Check for divergence with momentum indicators like RSI or MACD to reinforce bearish sentiment.
Step 3: Spot the Breakout Direction
- Downside Breakout (More Common): Price closes below the lower trendline, signaling increased selling pressure.
- Upside Breakout (Less Common): A breakout above the upper trendline may suggest unexpected bullish strength.
Step 4: Trading the Breakout
Bearish Trade (Downside Breakout)
- Wait for a decisive close below the lower trendline.
- Look for increased volume to confirm selling strength.
- Enter a short position.
- Set a stop-loss above the last swing high.
- Target previous support levels or major price consolidation zones.
Bullish Trade (Upside Breakout – Rare Case)
- Enter a long trade only after a strong breakout above the upper trendline.
- Confirm with high volume.
- Place a stop-loss below the recent swing low.
- Aim for key resistance levels.
Also see: Stop Loss . . . and its importance in trading – Some ways of setting up stop loss levels
Also see: Some ways of setting up take profit levels
Step 5: Manage Risk Effectively
- Use a fixed percentage of capital per trade.
- Adjust position sizes based on the stop-loss distance.
- Monitor price action and be ready to exit if momentum weakens.
- Be wary of false breakouts by waiting for a retest before entering trades.
Also see: How to determine one’s tolerance to risk?
Final Thoughts
The Rising Wedge is a powerful pattern that warns traders of potential trend reversals. While it often results in a bearish breakout, confirmation and risk management are key to successful trading. By incorporating technical indicators and multiple timeframes, traders can enhance their decision-making. Understanding the psychology behind the pattern can provide additional confidence in execution.
Try ChartAlert for Smarter Trading. Take your technical analysis to the next level with ChartAlert. Get a 4-week paid evaluation trial and spot patterns like the Rising Wedge with ease. Sign up today and trade smarter!